Simple Network Monitoring with Zabbix
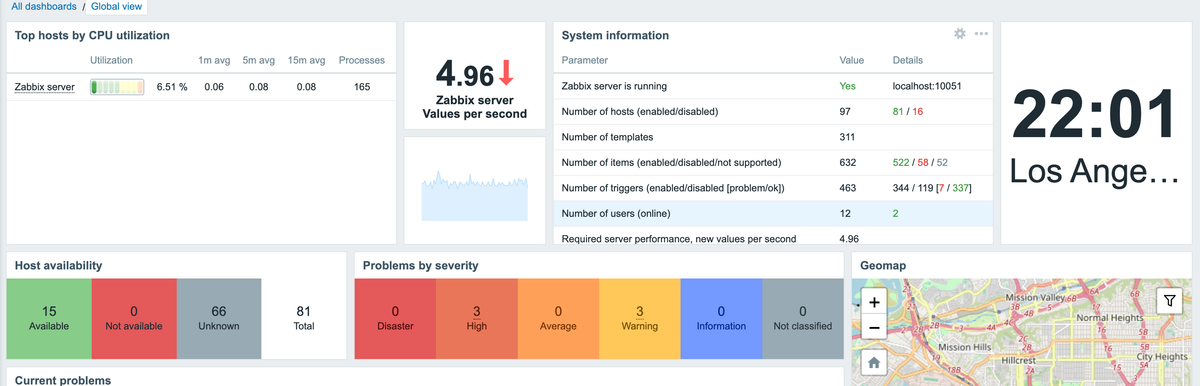
In IT, we live in a world full of monitoring solutions—especially cloud-based options. They’re powerful and easy to set up but often come with big licensing fees. What if you need something simple, cost-effective, and easy to manage? A tool that integrates with your existing stack and helps you keep your uptime while identifying and solving problems quickly?
At Packet6, we’re using Zabbix—an open-source monitoring solution that can handle these needs while still being powerful enough to scale with our business. We’re running a small shop in a multi-tenant environment and Zabbix provides the tools to guarantee our systems are up and running without burning a hole in the wallet.
What Is Zabbix?
Zabbix is a free, open-source monitoring solution designed for scalability and flexibility. It’s not a one-size-fits-all tool but it’s customizabe. Zabbix lets you monitor your entire infrastructure, from network devices and servers to applications.
Key Features:
- Scalability: Whether you’re monitoring a small office or an enterprise, Zabbix scales.
- Distributed Monitoring: Zabbix supports proxies—which we put on Raspberry Pi 4. The proxy offloads data collection from your main Zabbix server. This ensures you can monitor remote locations without overloading Zabbix.
Alerting: Don’t Miss a Beat
What good is monitoring if you don’t know when something goes wrong? Zabbix is excellent at trigger-based alerting, which ensures you’re notified the moment a problem arises.
- Trigger Thresholds: You can set thresholds for any metric—uptime, network latency, certificate expiration, bandwidth, etc—and Zabbix will monitor them in real-time.
- Trigger Actions: When thresholds are breached, Zabbix can automatically take predefined actions like sending an alert, restart a service, page the on-call engineer, or create a ticket in your incident management system.

With Zabbix’s alerting system, you can stay ahead of potential issues before they escalate into grueling outages. And to even get ahead of any phone calls from users.
Integration: Connect with Your Existing Tools
One of Zabbix’s advantages is its ability to integrate with tools we already use.
- Slack: Get alerts directly to Slack channels to keep our team informed in real-time. Alerts for different clients go into their respective channel.
- PagerDuty: Escalate alerts to our on-call team for faster incident resolution. And it follows our on-call schedule.
- Jira: Automatically create and manage incidents to streamline troubleshooting workflows. We haven’t implemented this yet because we want to make sure we aren’t bombarded by unnecessary tickets.
If there’s an API for it, chances are Zabbix can integrate.
Cost-Effective Monitoring for Any Business
Unlike many cloud-based solutions, Zabbix is entirely free—no licensing fees, no per-device costs. Be aware, they do have a cloud offering. This makes it ideal for:
- Small and Medium Businesses looking to monitor their infrastructure without breaking their IT budgets.
- Large Enterprises that need powerful, distributed monitoring tools without the recurring cost of commercial solutions.
Reducing MTTI and MTTR with Zabbix
When uptime matters, reducing Mean Time to Innocence (MTTI) and Mean Time to Resolution (MTTR) is critical. Zabbix offers several tools to help you pinpoint and resolve issues quickly:
- Drill Down into Metrics: Investigate performance issues using detailed metrics, logs, and thresholds.
- Graphing: Visualize metrics over time to spot anomalies or trends. Graphing is built-in.
- Trend Analysis: Use historical data to predict future resource needs or find potential bottlenecks.
- Real-Time Alerting: Notifications help you respond to issues the moment they occur.
- Event Correlation: Understand the relationship between events to spot root causes faster.
Zabbix gives you the insights you need to solve problems before they impact your users.
Just Getting Started with Zabbix
Getting started with Zabbix seems intimidating, but it’s worth the effort. Here are a few tips to help:
- Auto Discovery: Let Zabbix automatically discover devices and services on your network to save setup time.
- Incident Management: Integrate with tools like Jira to streamline your incident response process.
- Dashboards & APIs: Use Zabbix’s API to build custom integrations or connect with tools like Grafana for visualizations.
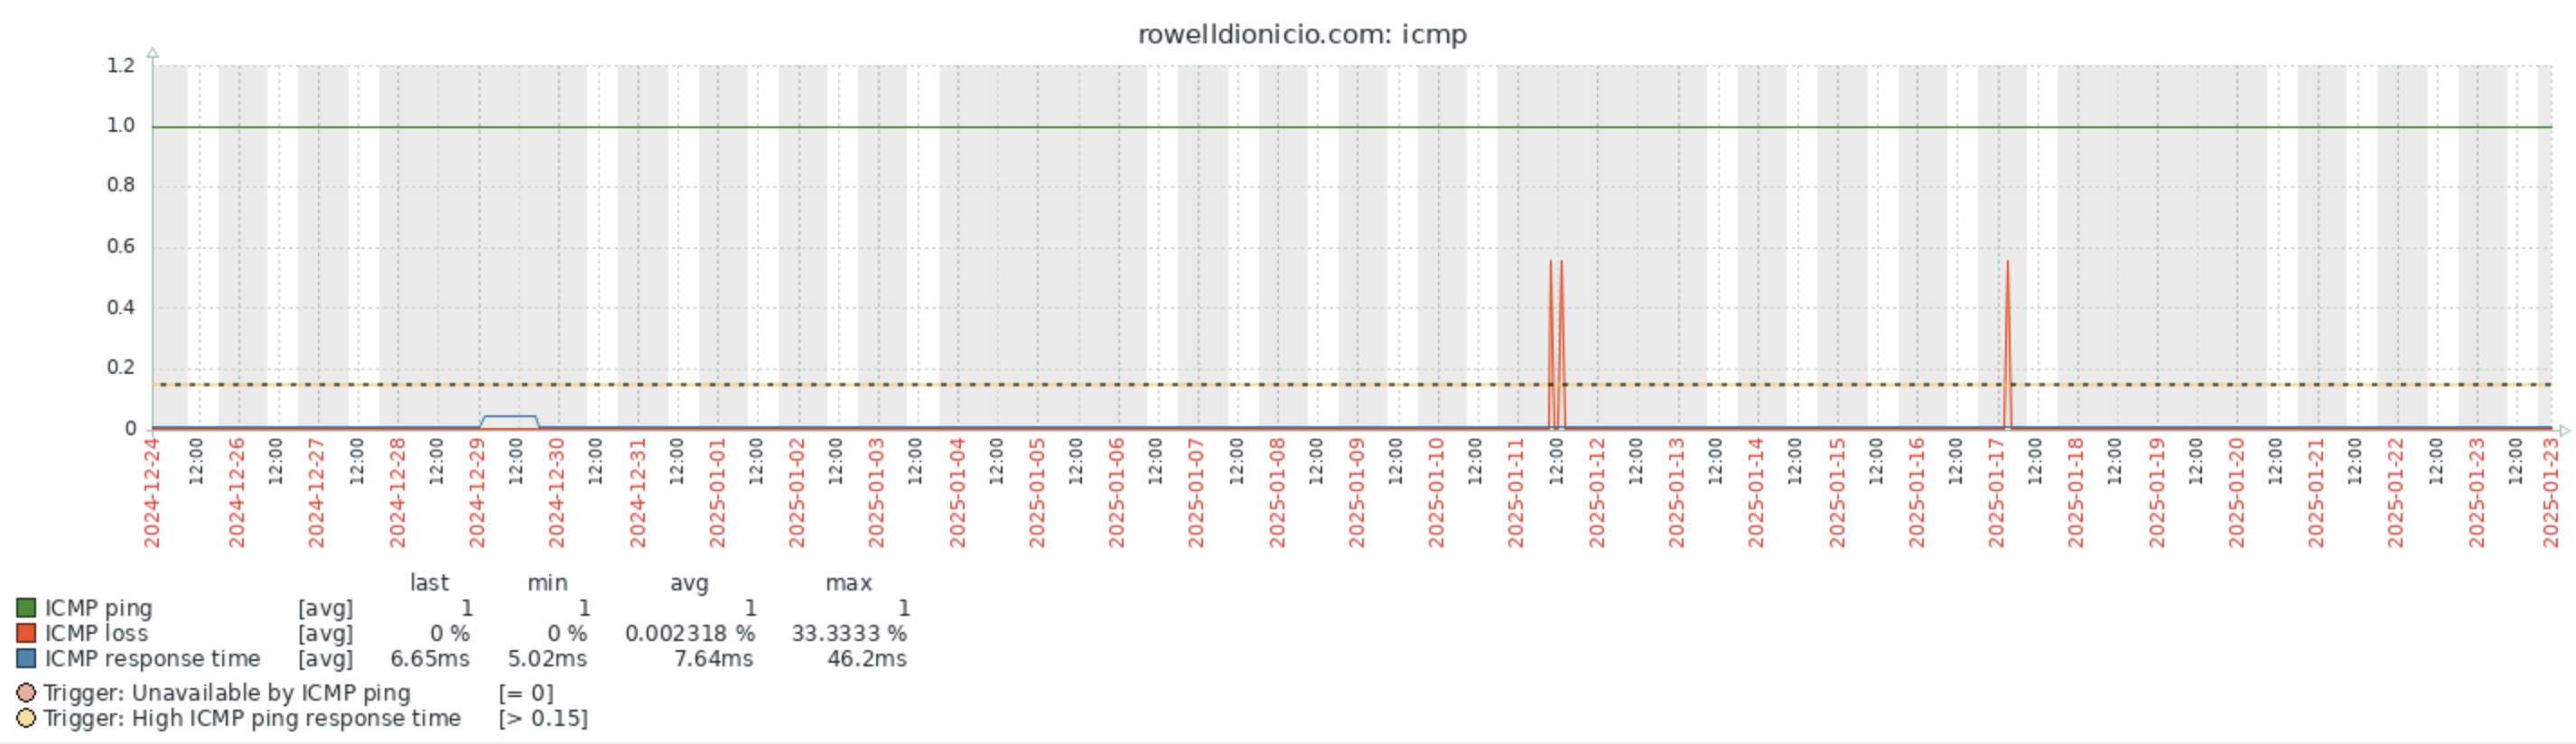
Zabbix has extensive documentation and their active forum community can also guide you through your setup process.
Final Thoughts
If you’re looking for a cost-effective, flexible, and open-source monitoring solution, Zabbix is exactly what you need. It offers robust features like distributed monitoring, real-time alerting, and seamless integrations—all without licensing fees.
Of course, Zabbix isn’t without its challenges. The learning curve can be steep, and the first setup needs some effort, especially in large-scale environments. But for those willing to invest the time, Zabbix provides a level of monitoring power and flexibility that rivals even the most expensive cloud-based solutions.
How are you managing monitoring today? Share your thoughts and experiences in the comments!